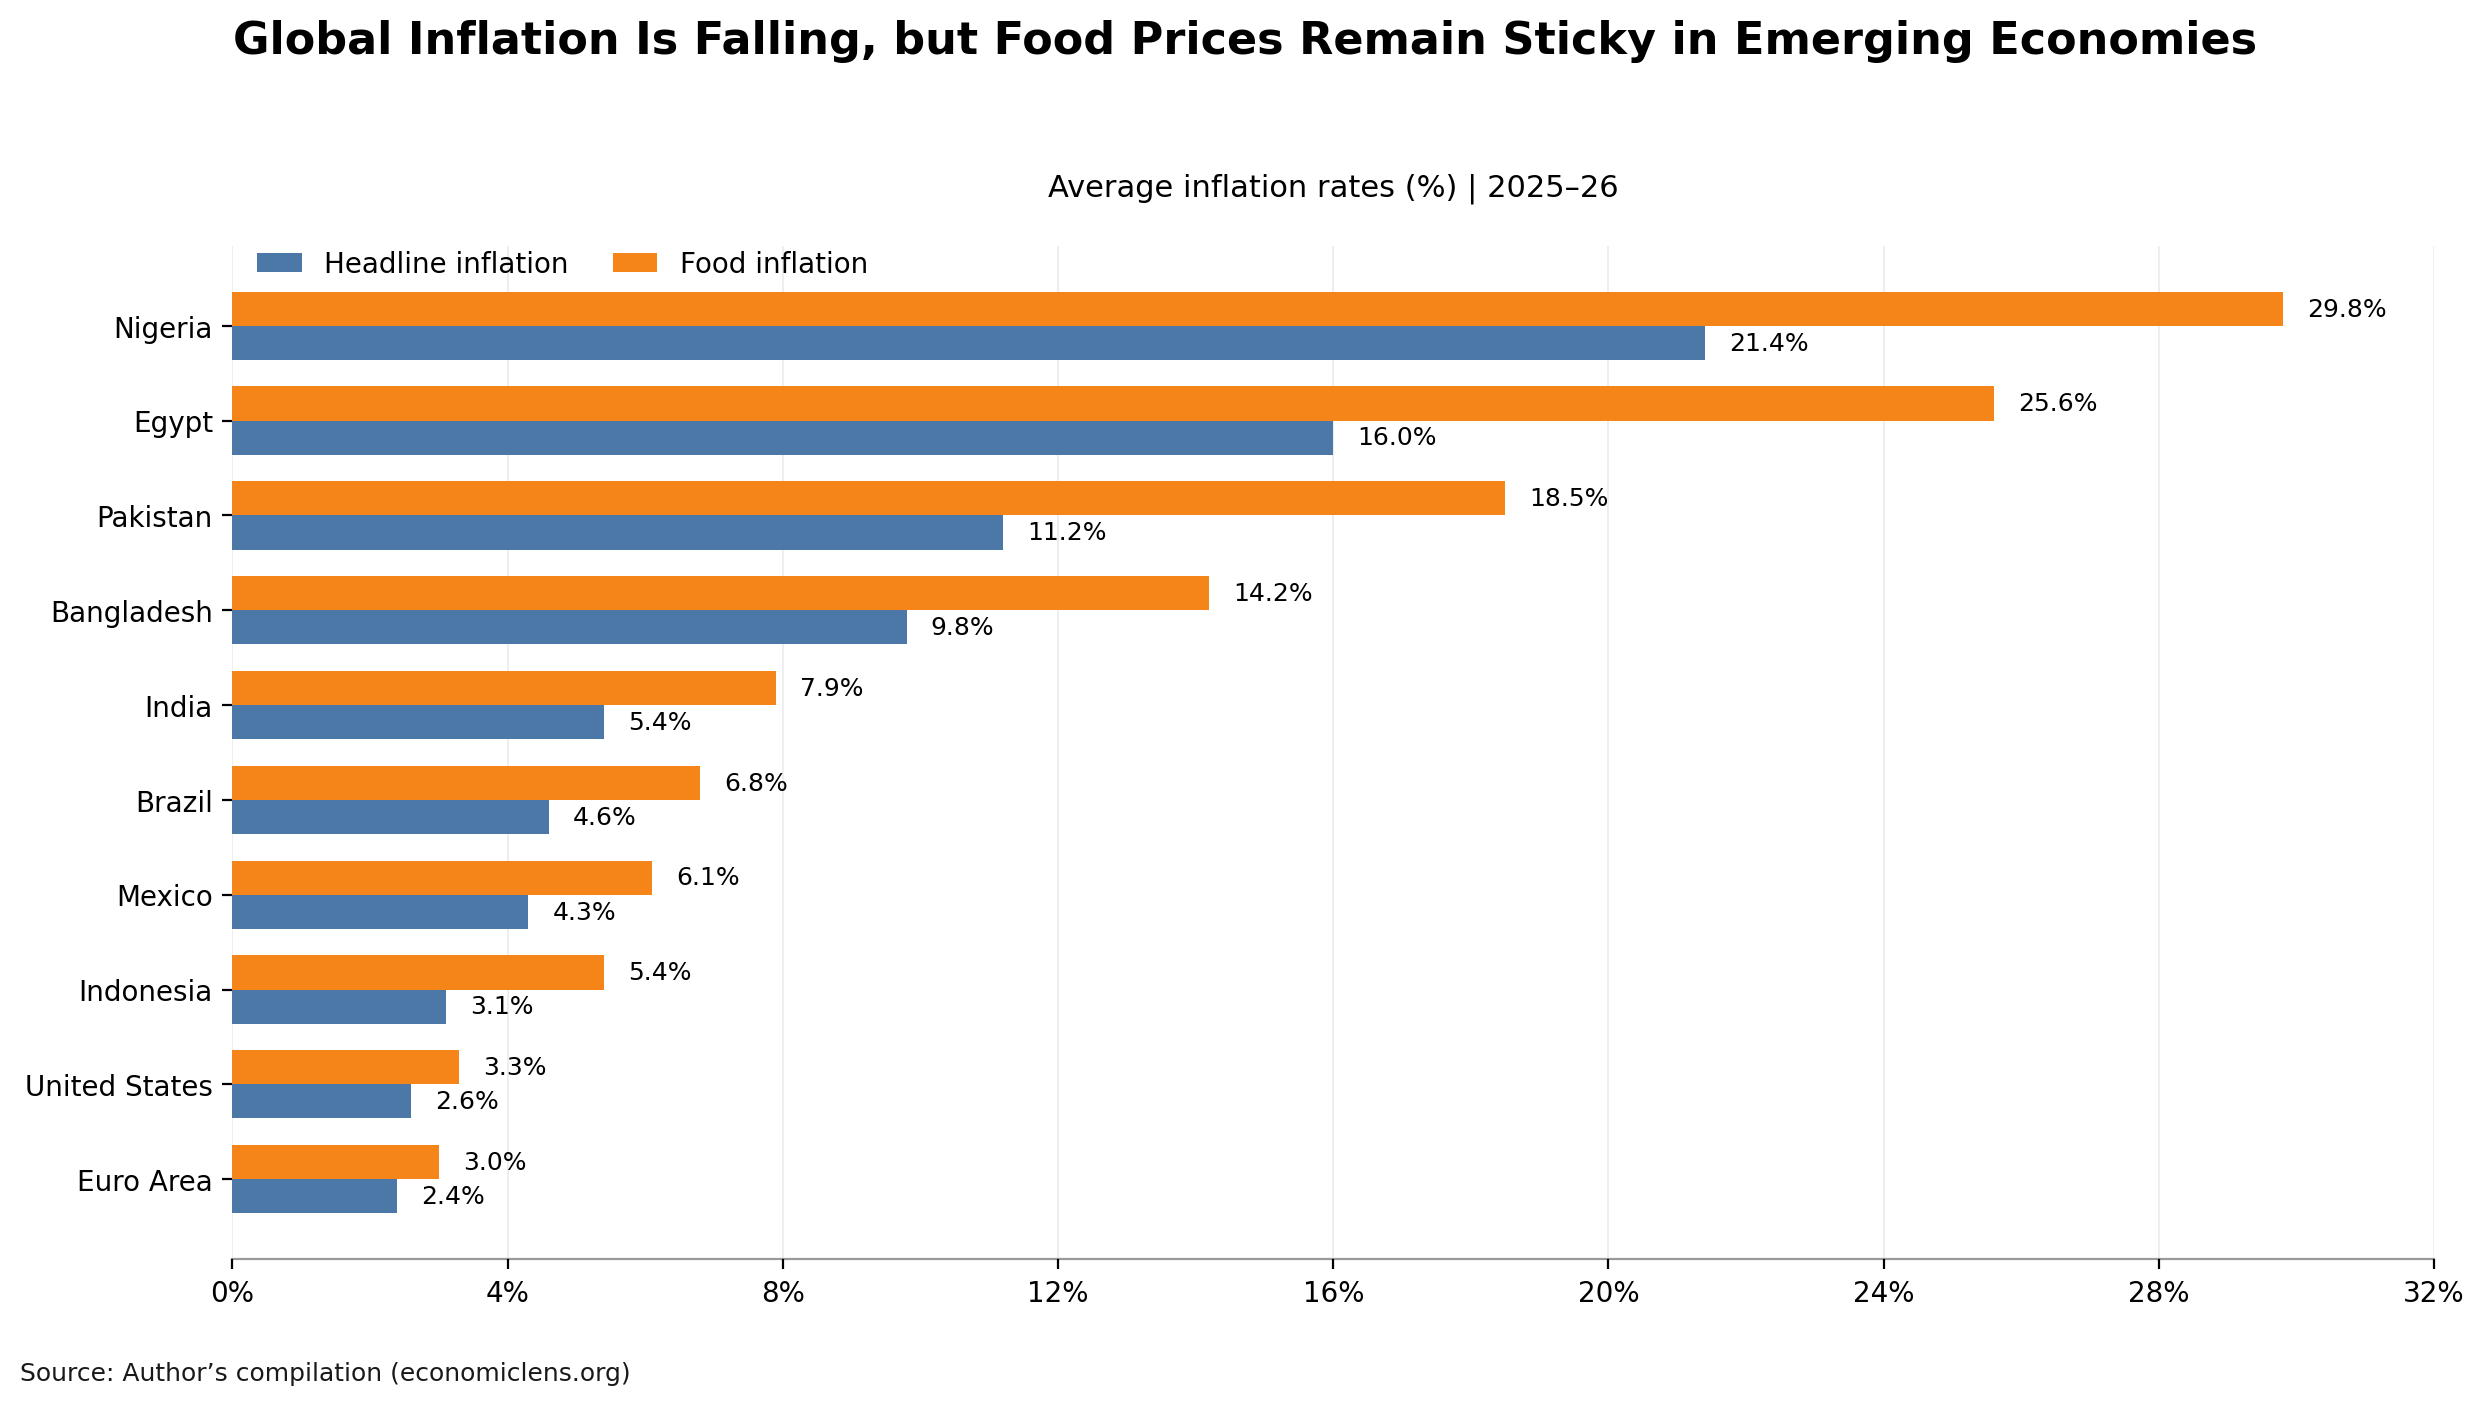
Food inflation in emerging economies remains stubbornly high despite easing global inflation. Using cross-country data and IMF and FAO insights, this analysis explains why food prices remain sticky, how this
Food inflation in emerging economies remains stubbornly high despite easing global inflation. Using cross-country data and IMF and FAO insights, this analysis explains why food prices remain sticky, how this
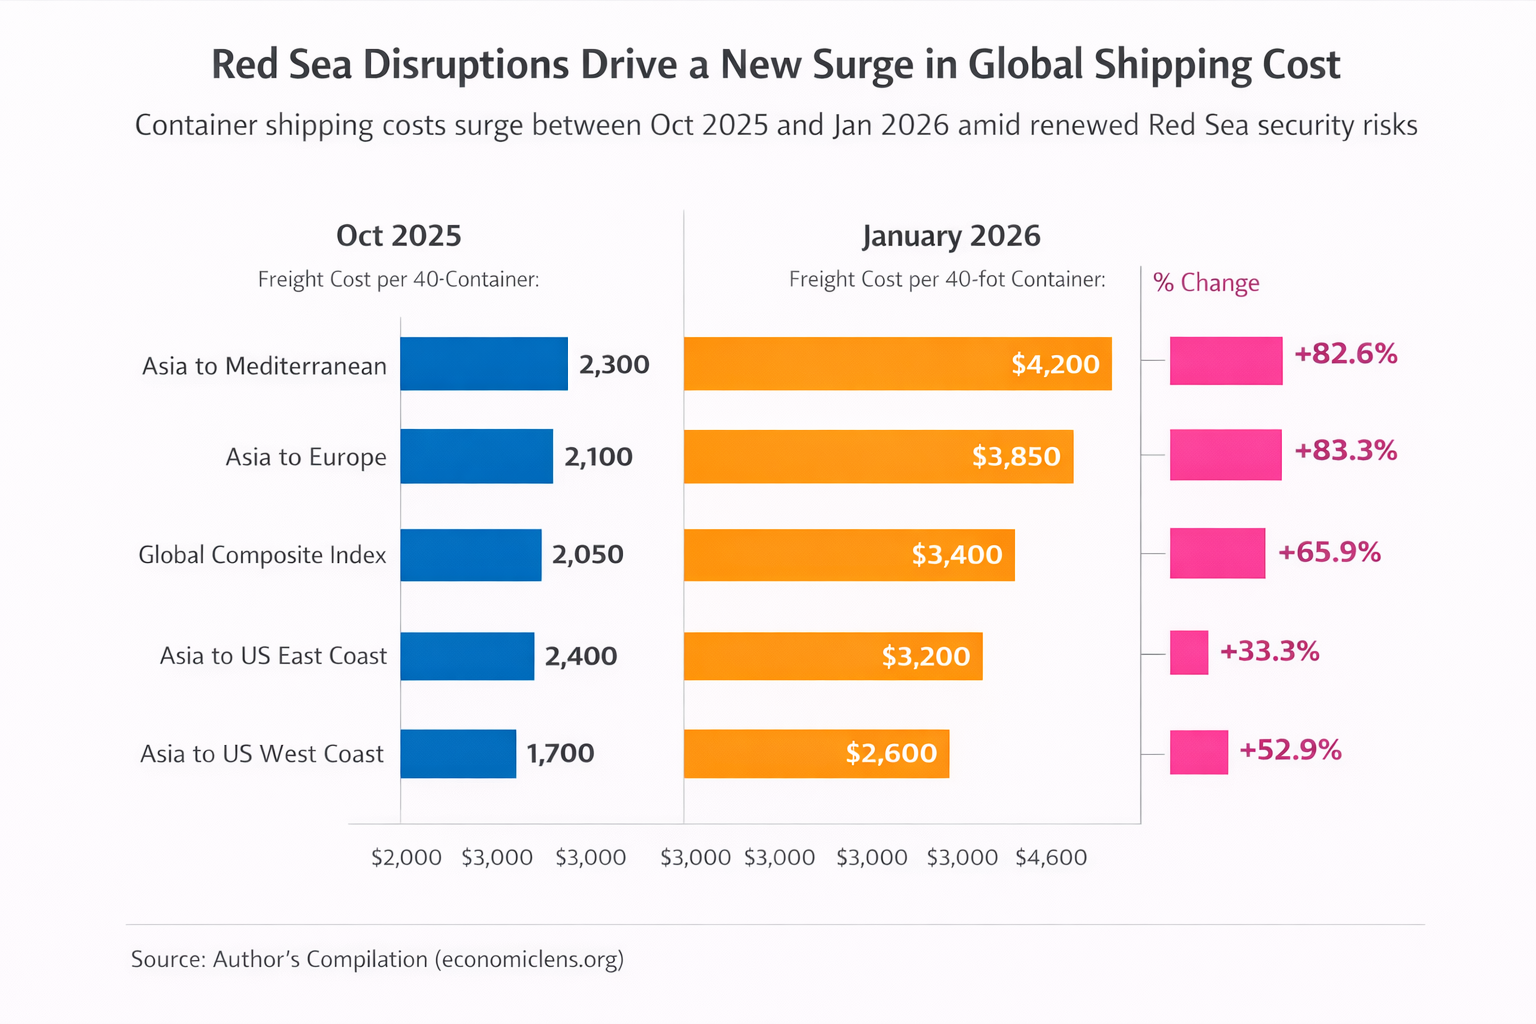
The Red Sea shipping cost surge has emerged as one of the most consequential trade developments in early 2026. As this Chart of the Week shows, container freight rates climbed
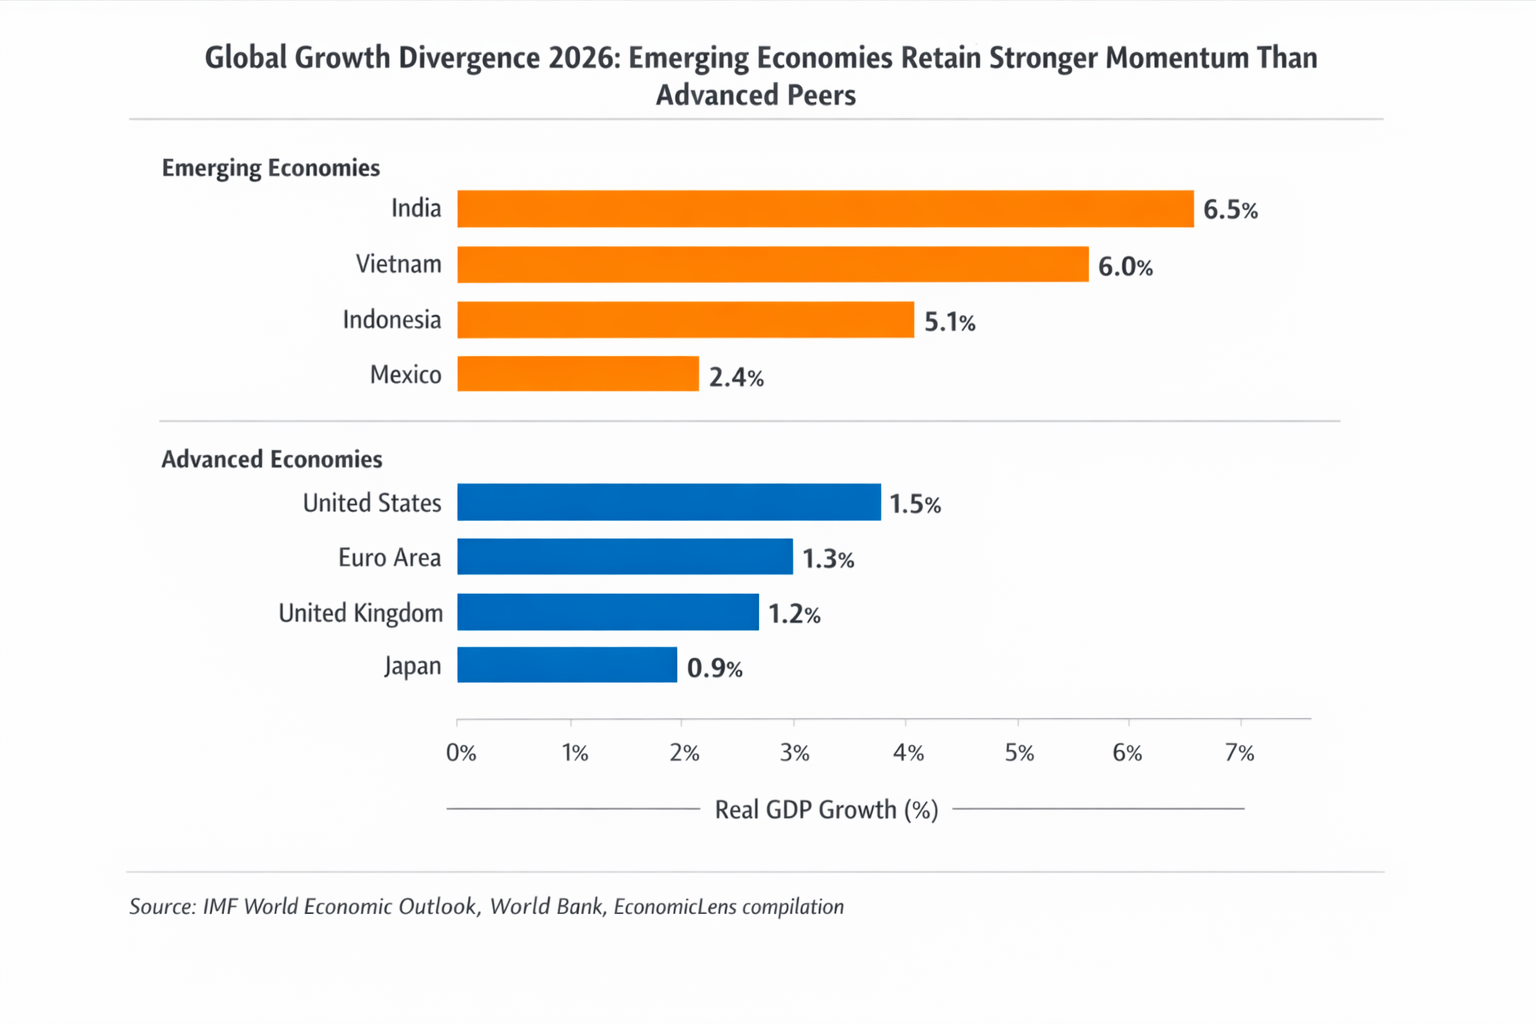
Global growth divergence 2026 shows emerging economies sustaining stronger momentum than advanced peers as tight financial conditions, aging demographics, and weak investment weigh on rich economies. Using IMF and World
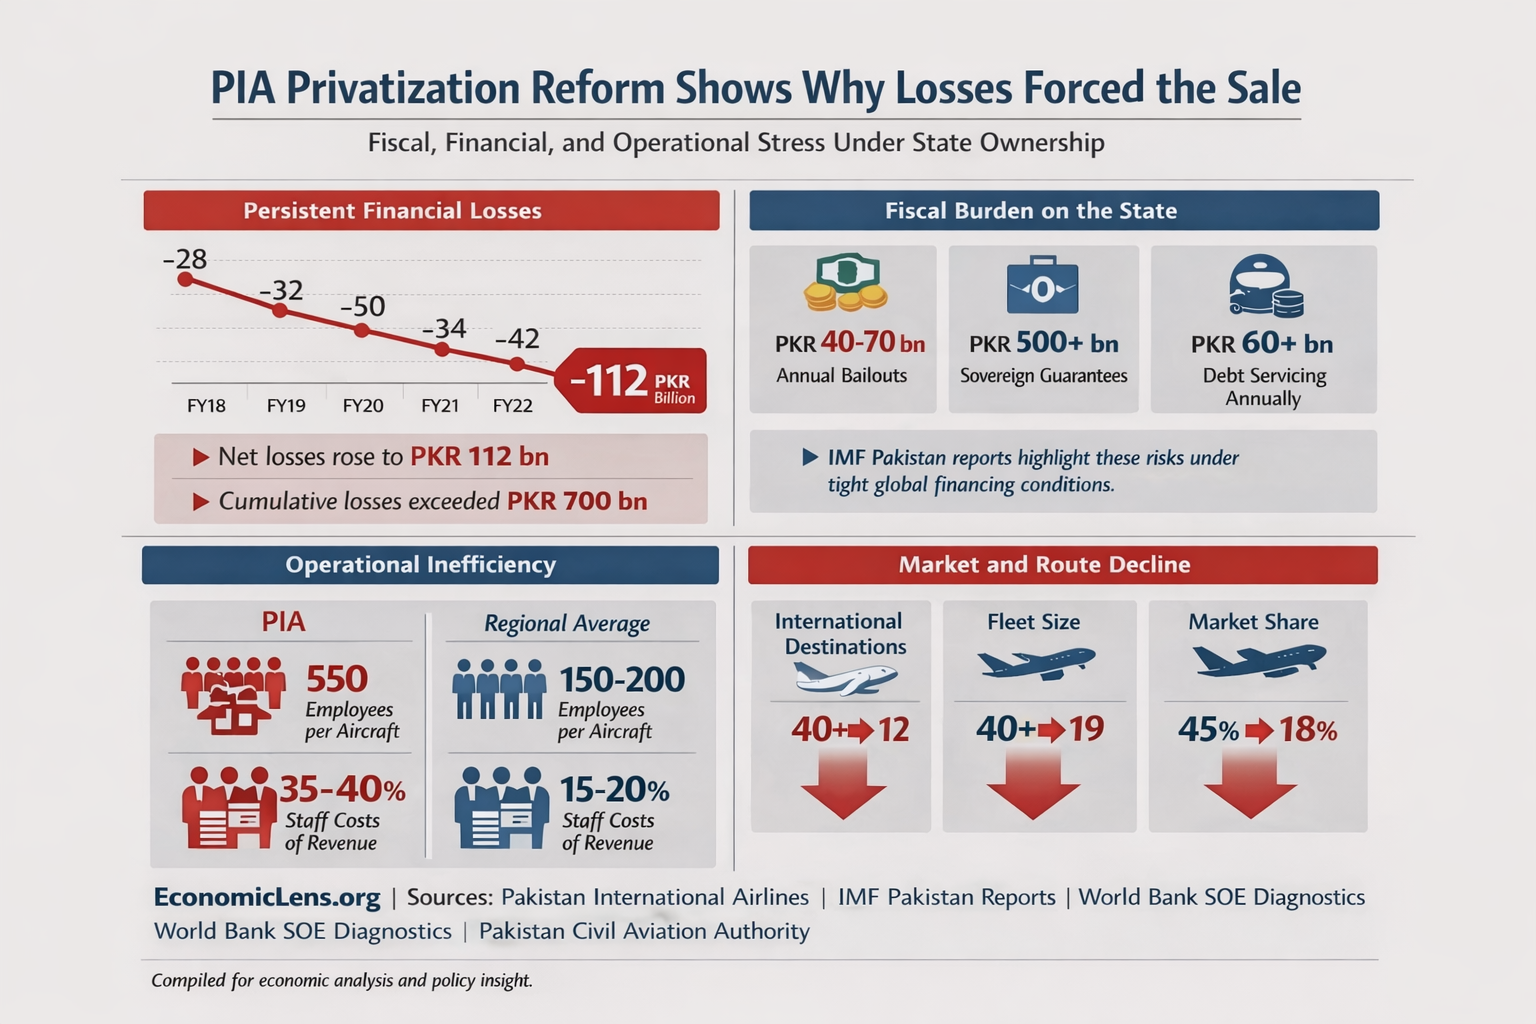
PIA privatization reform highlights how prolonged losses, rising fiscal exposure, and weak productivity can force decisive policy change. While repeated bailouts delayed collapse, inefficiencies deepened. This chart-based visual story explains
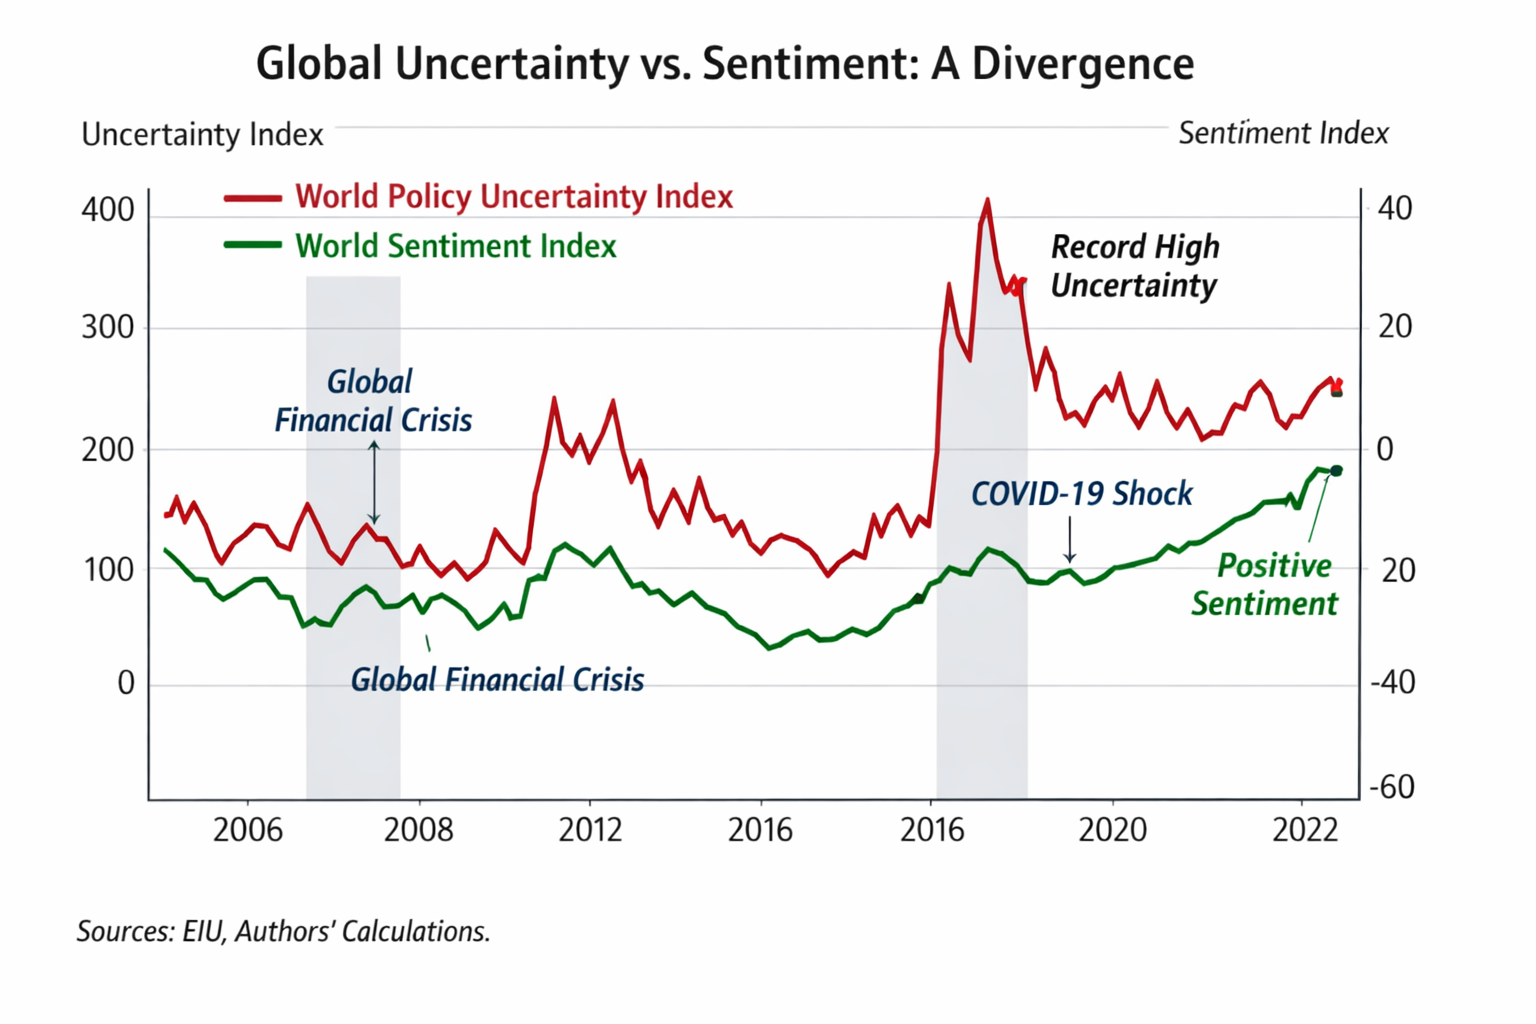
Global policy uncertainty and economic sentiment show a widening gap since 2008. Policy risk surges during global shocks, yet economic sentiment recovers faster. This chart-based visual story explains the causes,