Trump’s tax legacy has become a central factor shaping U.S. fiscal balances, inequality trends, and global economic spillovers in the post pandemic period. While the Tax Cuts and Jobs Act was initially framed as a pro growth reform, its longer term fiscal and distributional effects have become clearer by late 2025. Consequently, questions around debt accumulation and inequality now dominate policy discussions.
This blog examines post 2017 fiscal outcomes using macroeconomic indicators, sectoral performance, inequality metrics, and international spillover evidence drawn from the Congressional Budget Office, IMF, OECD, and World Bank.
The analytical framework applied in this assessment reflects the post 2017 fiscal framework, U.S. tax cuts legacy, tax driven inequality, public debt dynamics, global fiscal spillovers.
U.S. Macroeconomic Conditions after the Tax Reforms
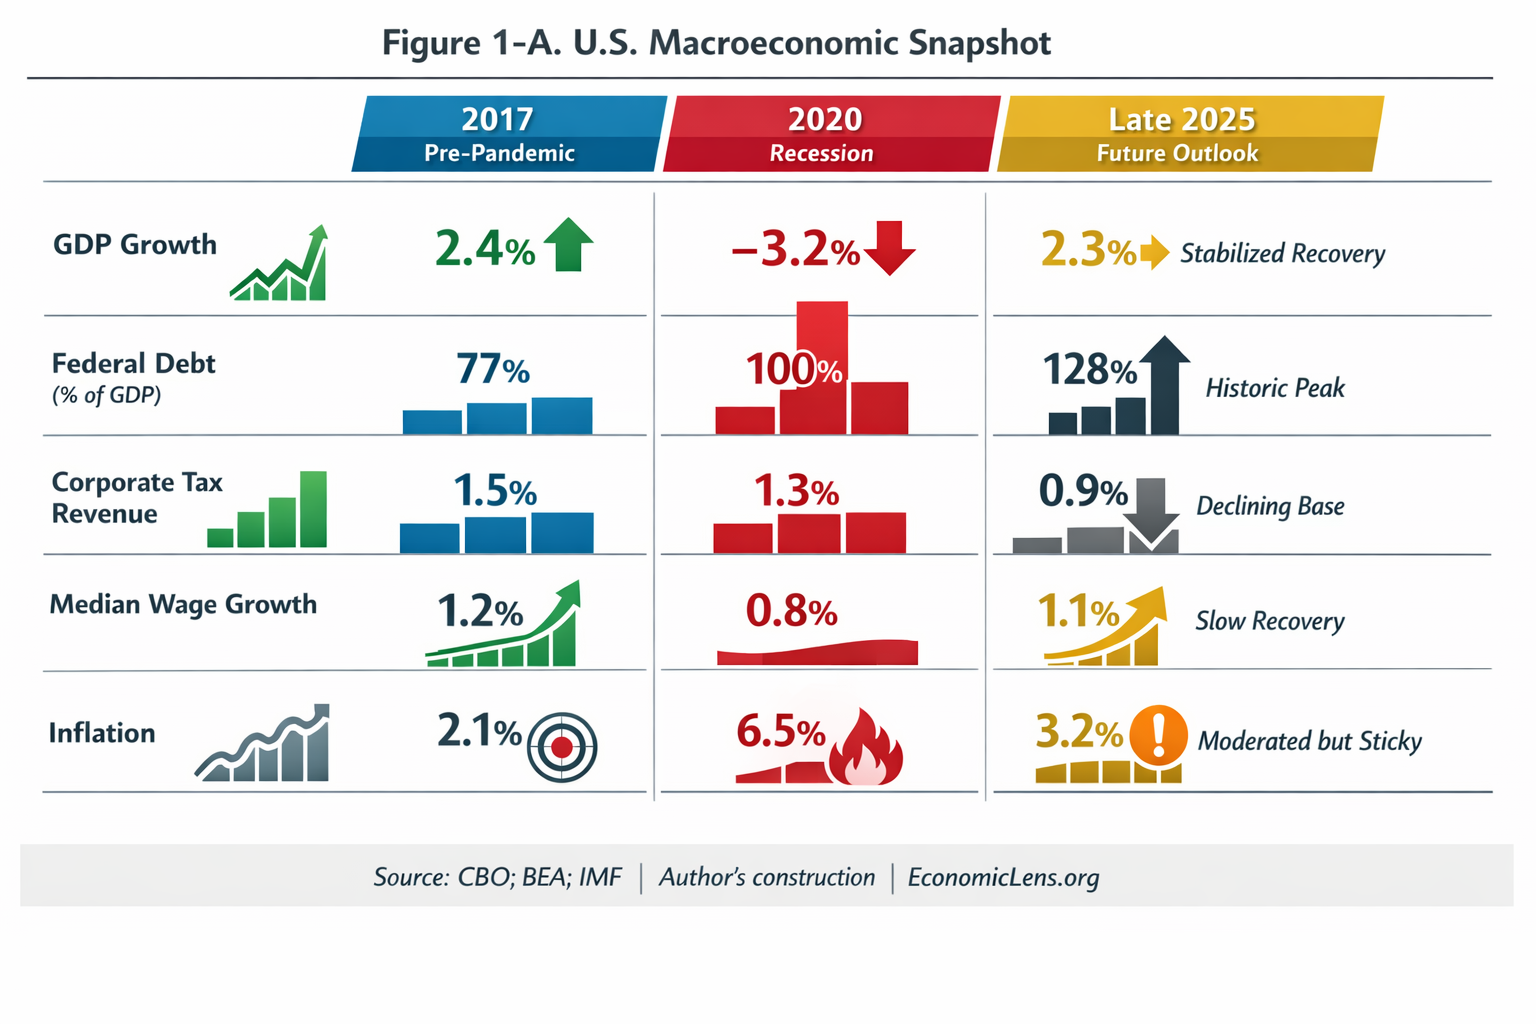
The U.S. economy experienced a sharp contraction in 2020 followed by a partial recovery. By late 2025, GDP growth stabilized near its pre pandemic average. However, fiscal pressures intensified during the same period. This debate has also intensified amid renewed recession warnings in advanced economies flagged in recent IMF outlook updates.
Figure 1-A shows that federal debt increased sharply relative to GDP, while corporate tax revenue declined as a share of output. Median wage growth remained subdued, and inflation moderated but did not fully normalize. As a result, macroeconomic stabilization occurred alongside growing fiscal strain.
Links: https://www.cbo.gov, https://www.bea.gov, https://www.imf.org
Sectoral Performance Under Trump Era Tax Policy
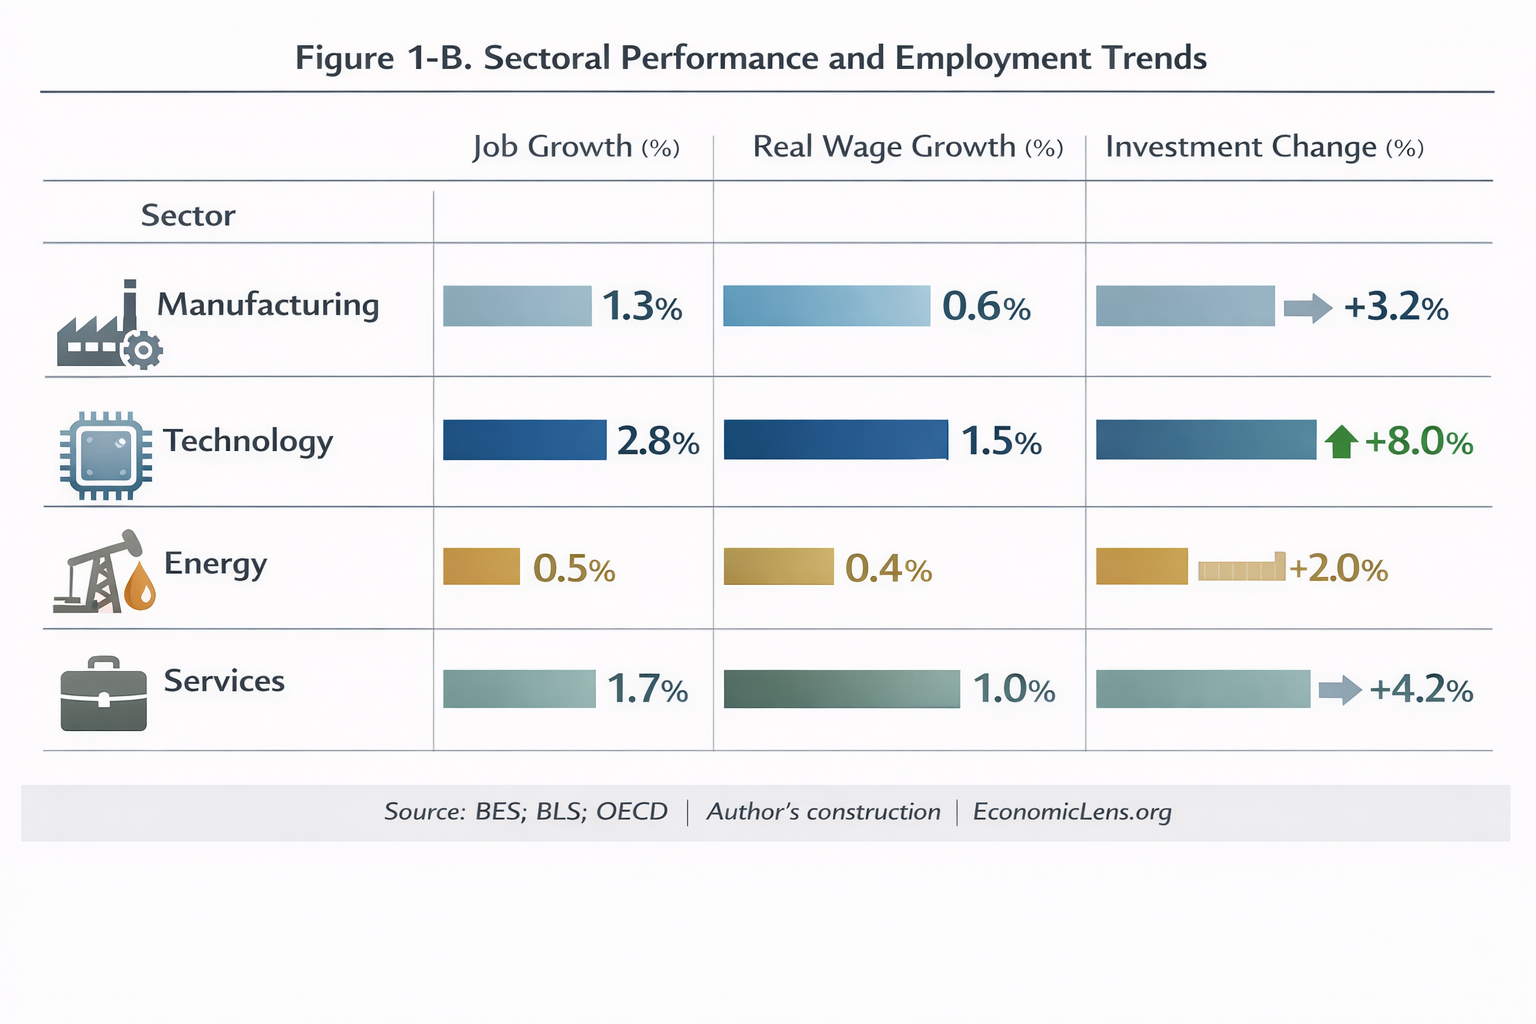
Sectoral data reveal uneven economic gains. Technology recorded the strongest job creation and investment growth, while manufacturing and energy showed weaker momentum. Services performed moderately across employment and wages. These sectoral shifts mirror broader AI investment surges and labor displacement trends observed across major OECD economies in 2024 and 2025.
Real wage growth lagged job growth in most sectors. This divergence suggests that capital deepening outpaced broad based income gains. Moreover, the distribution of benefits across sectors remained uneven.
Links: https://www.bls.gov, https://www.oecd.org
Inequality Outcomes Shaped by Trump’s Tax Legacy
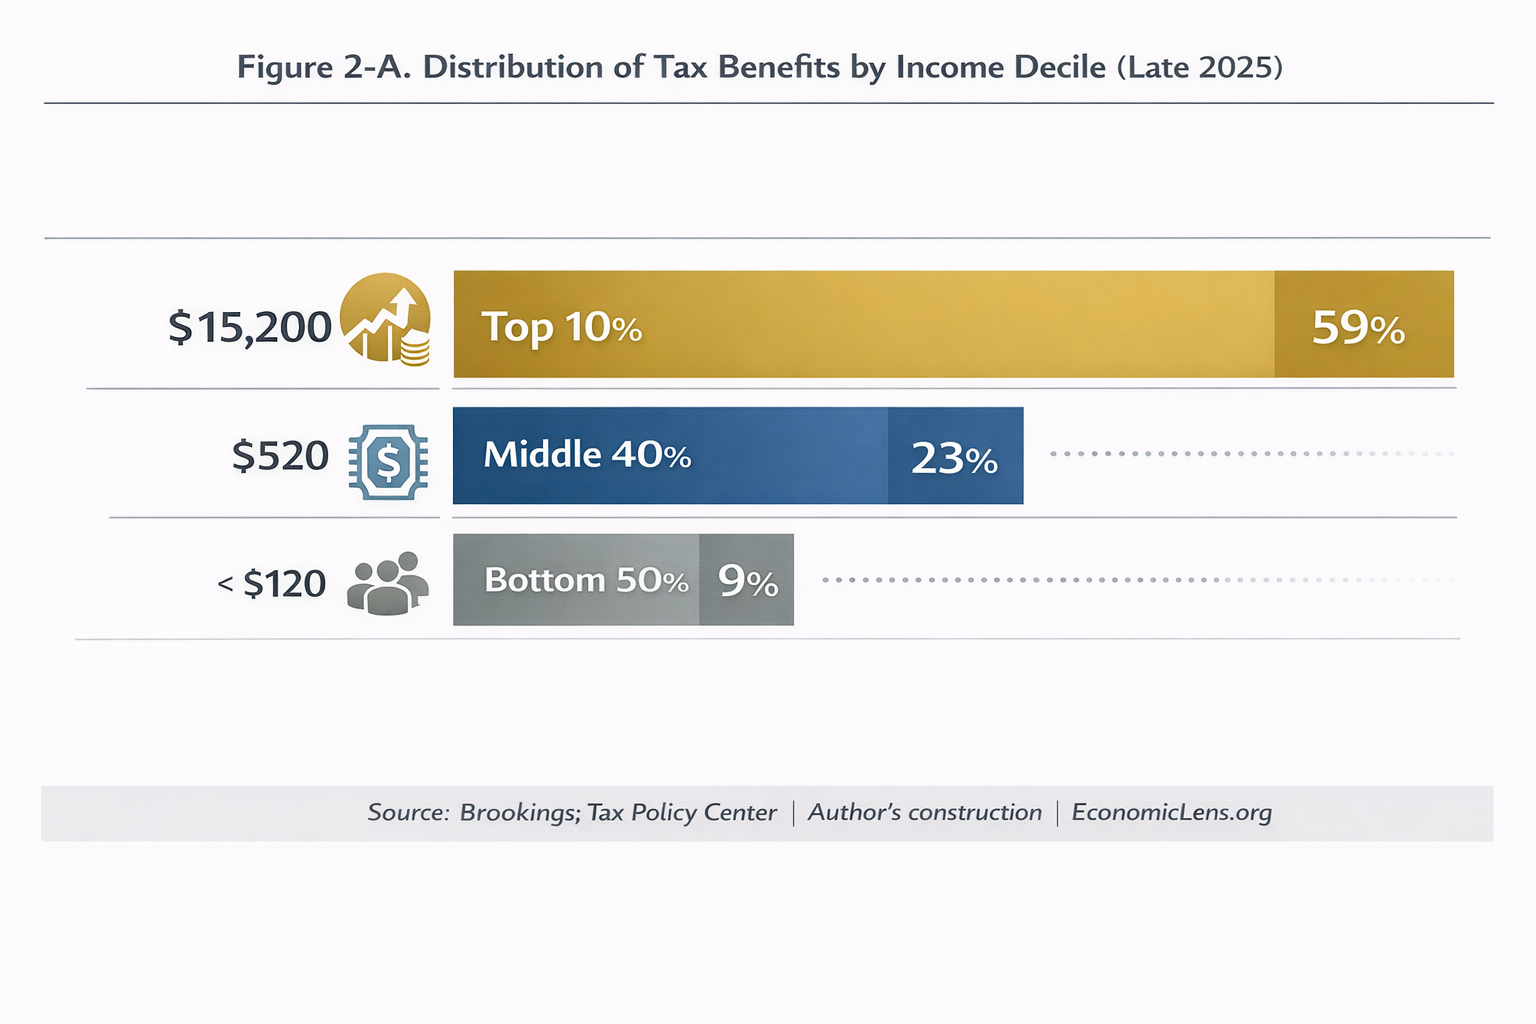
Tax benefit distribution highlights significant concentration at the top of the income scale. Figure 2-A shows that the top 10 percent captured the majority of total tax benefits, while the bottom half received a limited share. Rising inequality has also become a political flashpoint globally, influencing electoral outcomes in major cities and advanced democracies.
These distributional tensions are also shaping contemporary political outcomes, as reflected in recent urban electoral shifts discussed in Zuhran Mamdani’s 2025 New York mayoral victory:
https://economiclens.org/zuhran-mamdanis-victory-key-factors-behind-his-win-in-new-yorks-2025-mayoral-election/
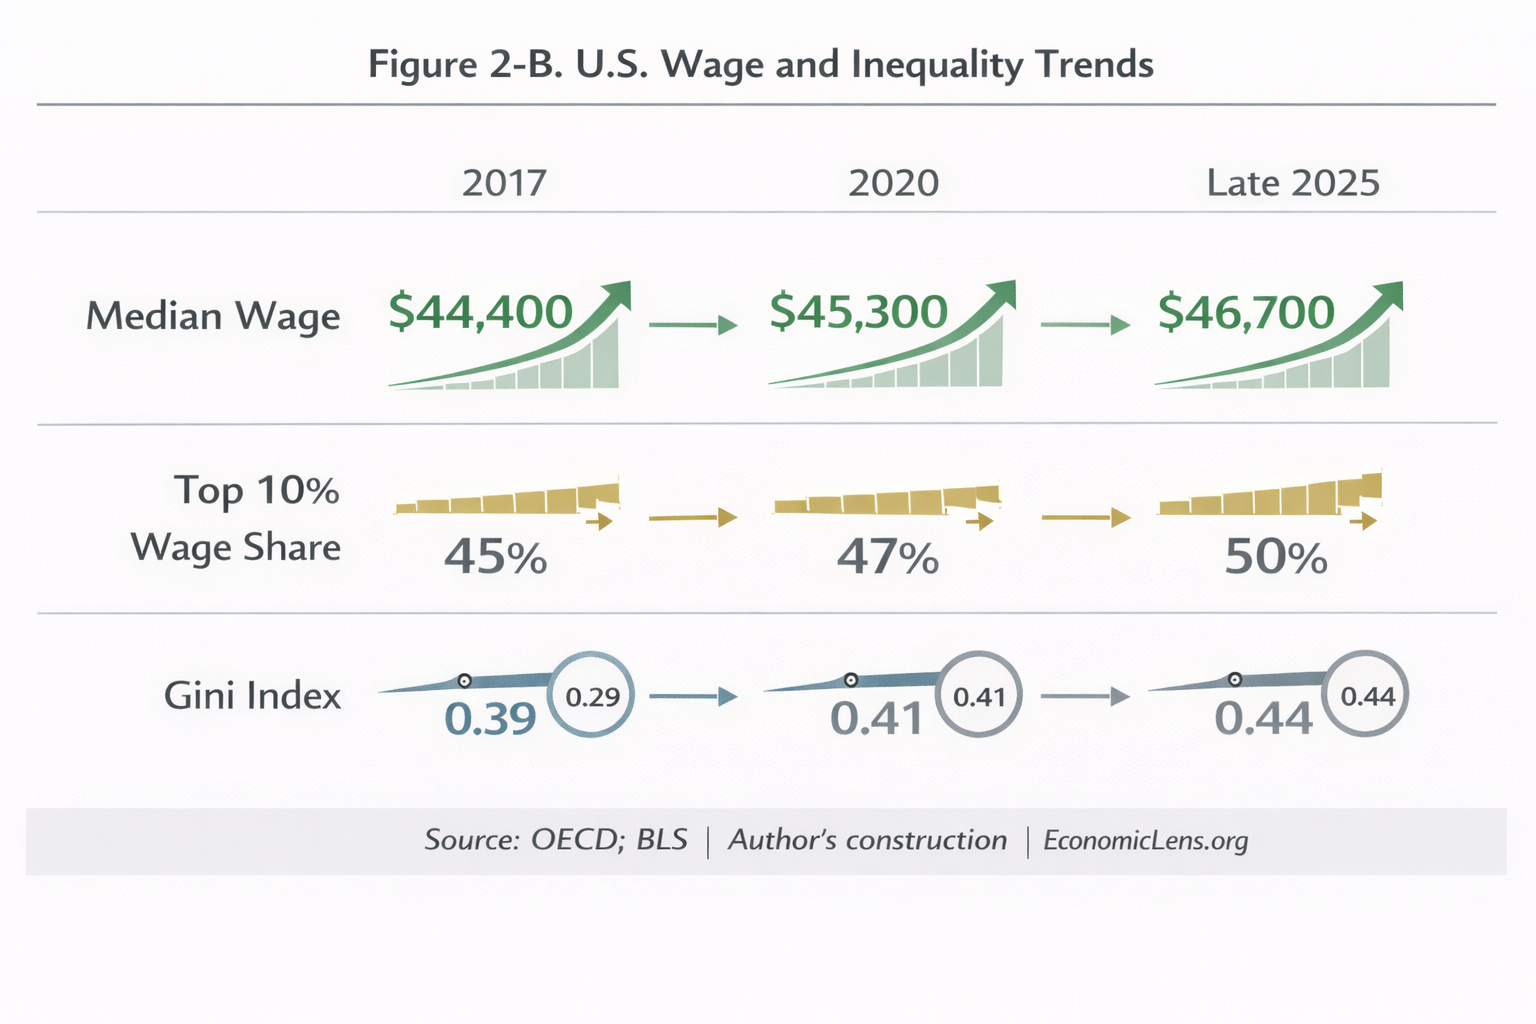
At the same time, wage inequality increased. Figure 2-B indicates that the top 10 percent wage share rose steadily between 2017 and late 2025. The Gini index followed a similar upward path, even as median wages grew modestly. Therefore, inequality widened despite overall economic recovery.
Links: https://www.brookings.edu, https://www.taxpolicycenter.org
Links: https://www.oecd.org, https://www.bls.gov
Federal Debt Dynamics Under Trump’s Tax Legacy
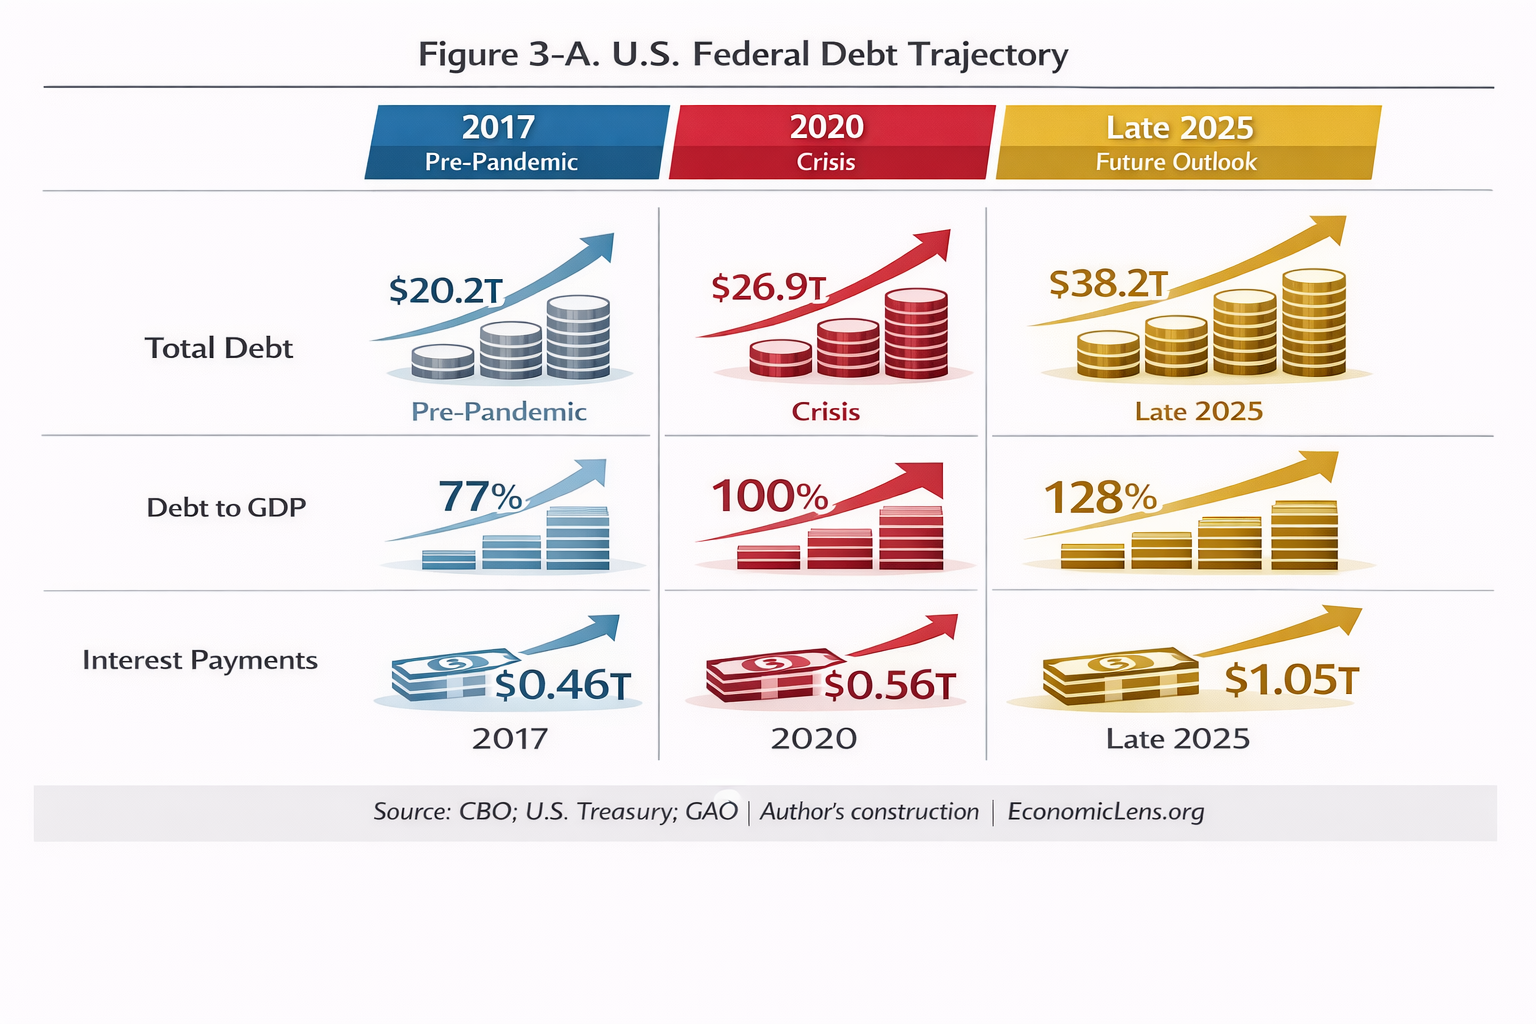
Federal debt growth represents one of the most visible long term outcomes associated with Trump’s tax legacy. Figure 3-A shows that total federal debt and interest payments rose sharply between 2017 and late 2025. Similar debt sustainability concerns are emerging across advanced economies as interest rates remain structurally higher.
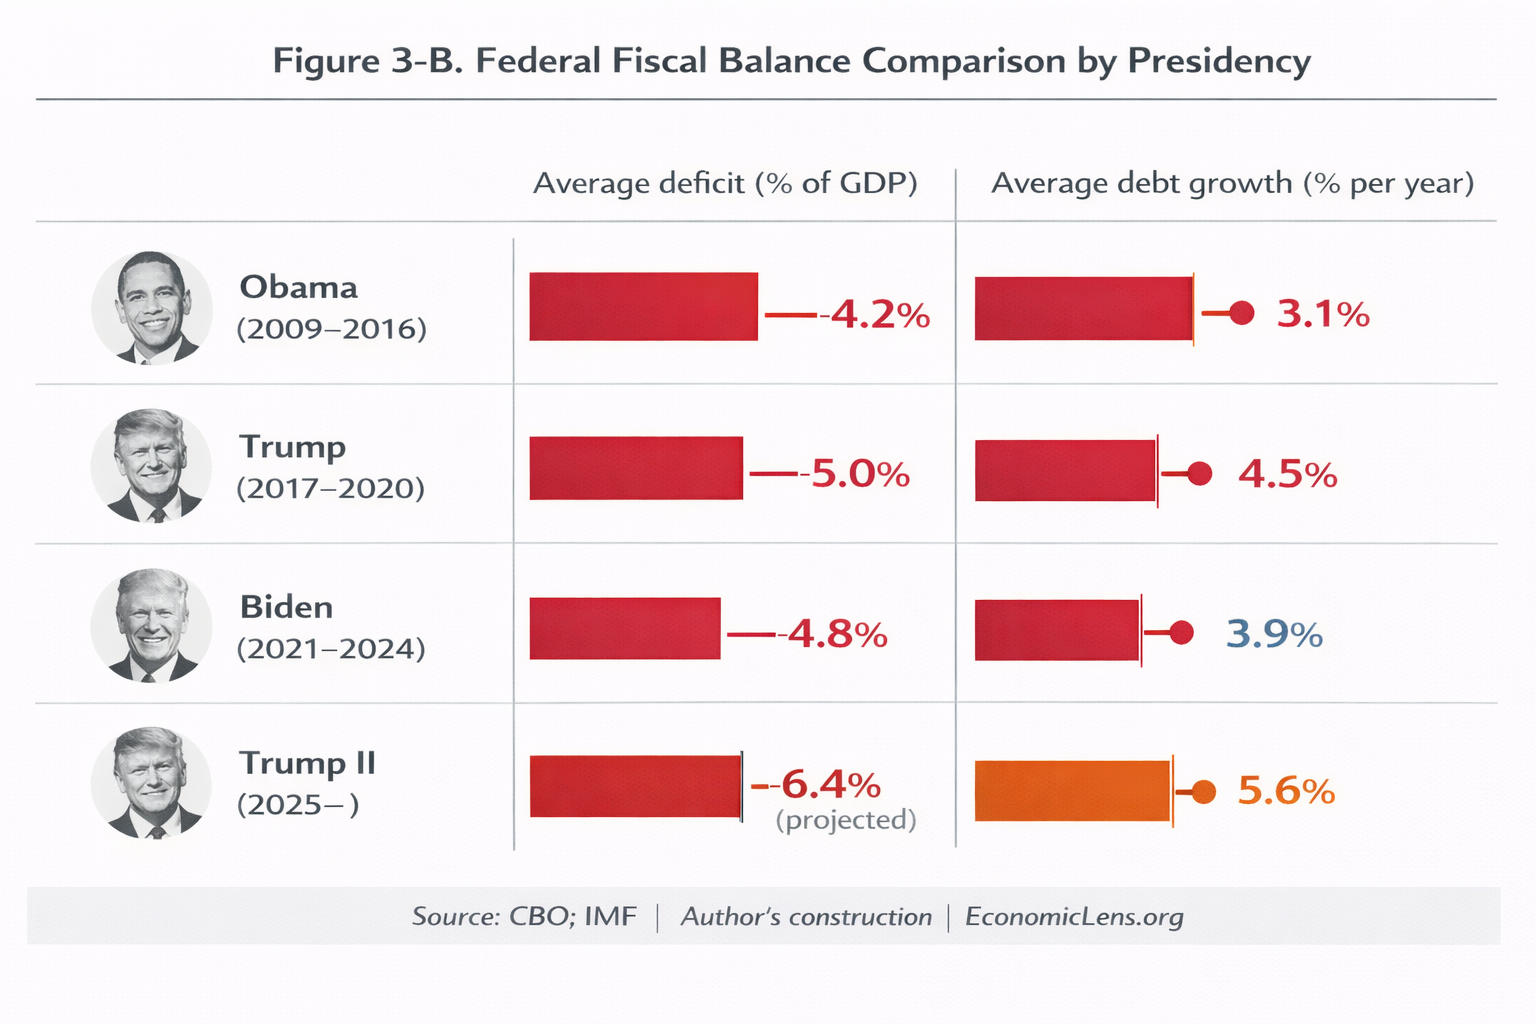
Fiscal balances varied by administration. As shown in Figure 3-B, average deficits and debt growth rates increased during periods of expansionary fiscal policy. Consequently, interest servicing now absorbs a larger share of federal resources.
Links: https://www.cbo.gov, https://home.treasury.gov, https://www.gao.gov
Links: https://www.cbo.gov, https://www.imf.org
Global Spillover Effects
U.S. fiscal expansion has generated spillover effects across global financial markets. These spillovers interact with broader external shocks, including recent trade disruptions analyzed in the U.S. tariff shock and its global inflation and supply chain risks:
https://economiclens.org/us-tariff-shock-2025-global-trade-fallout-inflation-and-supply-chain-risks/
Figure 3-C shows that sovereign yields increased across emerging regions following tighter global financial conditions. Latin America and Sub Saharan Africa experienced the strongest yield pressures and heightened default risks. In contrast, advanced economies adjusted primarily through tighter monetary policy. These pressures coincide with heightened global trade fragmentation and tariff driven supply chain disruptions.
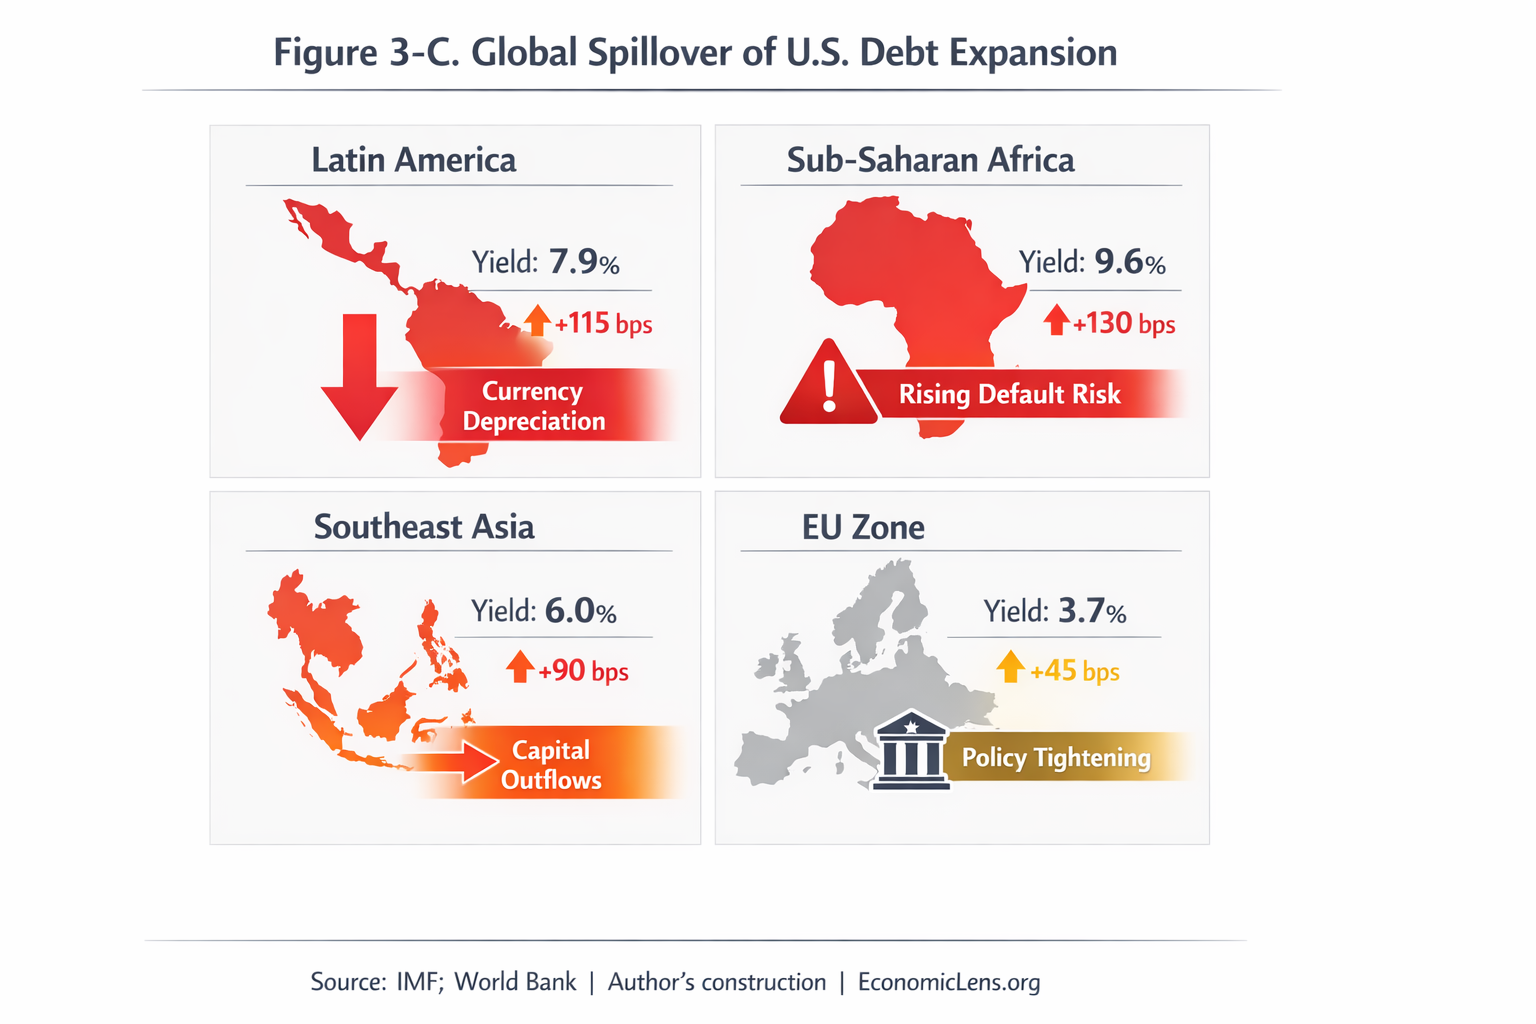
Links: https://www.imf.org, https://www.worldbank.org
Conclusion
In summary, Trump’s tax legacy shaped fiscal outcomes through higher debt levels, uneven sectoral gains, and widening income inequality. While economic recovery has been achieved, fiscal space has narrowed, and global spillovers have intensified.
The long term implications of Trump’s tax legacy will therefore continue to influence fiscal policy debates beyond 2025. Going forward, policymakers face difficult trade offs between sustaining growth, restoring revenue capacity, and managing debt dynamics. Addressing these challenges will be central to improving long term economic resilience in the United States and beyond.